XTRAN Example — Generate HTML Table Rows from DSV Data
Scenario — we had a spreadsheet containing about 400 XTRAN error codes and their corresponding error messages. We needed to show that information in the XTRAN User's Manual, as an HTML table. But generating the HTML table rows from the data is a tedious, boring, and error-prone job.
XTRAN to the rescue!The following example uses an XTRAN rules file comprising 257 non-comment lines of XTRAN's rules language ("meta-code") to generate rows for an HTML table from DSV data (Delimiter-Separated Values). The rules took just over 2 hours to write and about 1.5 hours hours to debug. (That's right, less than 4 hours total!)
The rules read header and optional justification information about each of the data's columns, then read DSV data and generate the HTML table's rows (including a header row). You can specify the delimiter character used in your DSV data; it defaults to comma.
For each table column, you can optionally specify its justification — left, centered, or right. If you don't specify that for a given column, the rules default the column to left-justified, except that if all values in the column are numeric, it is right-justified.
The rules also handle missing and elided column labels and values.
We exported our spreadsheet data in DSV form, ran the
result through these rules, added appropriate <TABLE> and
</TABLE> tags at the beginning and end, and voila! We
had our HTML table in the manual.
How can such powerful and generalized data and HTML manipulation be automated in less than 4 hours and only 257 code lines of XTRAN rules? Because there is so much capability already available as part of XTRAN's rules language. These rules take advantage of the following functionality:
- Text file input and output
- Text manipulation
- Text formatting
- Delimited list manipulation
- Environment variable manipulation
- Content-addressable data bases
The input to and output from XTRAN are untouched.
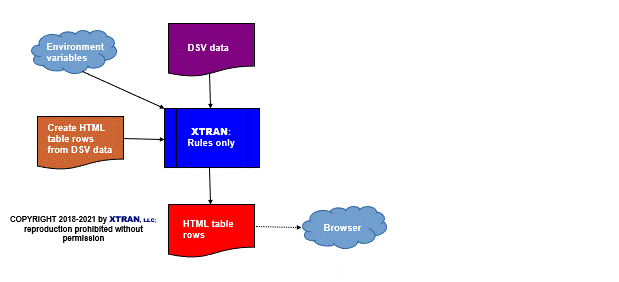
Process Flowchart
Here is a flowchart for this process, in which the elements are color coded:
- BLUE for XTRAN versions (runnable programs)
- ORANGE for XTRAN rules (text files)
- RED for
code - PURPLE for text data files

Input to XTRAN:
; Table header row:
;
Month;Profit;Flag/C;Comment
;
; Data:
;
January;500,000;Y;A good month
February;-100,000;N;Bottom fell out
March;150,000;N;Starting to recover
April;1,000,000;;We're back in the clover!
Notes:
- The
/Con theFlagcolumn header tells the rules to center that column. - All
Profitvalues are numeric, so the rules will automatically right-justify that column. - The fourth data row has no value for the
Flagcolumn. - We defaulted vertical alignment to
"top".
Output from XTRAN, as rendered by your
browser (with <TABLE> tags added manually):
| Month | Profit | Flag | Comment |
|---|---|---|---|
| January | 500,000 | Y | A good month |
| February | -100,000 | N | Bottom fell out |
| March | 150,000 | N | Starting to recover |
| April | 1,000,000 | We're back in the clover! |
Output from XTRAN, as HTML
(with <TABLE> tags added manually):
<TABLE> <TR> <TH ALIGN="left" VALIGN="top"> Month </TH> <TH ALIGN="right" VALIGN="top"> Profit </TH> <TH ALIGN="center" VALIGN="top"> Flag </TH> <TH ALIGN="left" VALIGN="top"> Comment </TH> </TR> <TR> <TD ALIGN="left" VALIGN="top"> January </TD> <TD ALIGN="right" VALIGN="top"> 500,000 </TD> <TD ALIGN="center" VALIGN="top"> Y </TD> <TD ALIGN="left" VALIGN="top"> A good month </TD> </TR> <TR> <TD ALIGN="left" VALIGN="top"> February </TD> <TD ALIGN="right" VALIGN="top"> -100,000 </TD> <TD ALIGN="center" VALIGN="top"> N </TD> <TD ALIGN="left" VALIGN="top"> Bottom fell out </TD> </TR> <TR> <TD ALIGN="left" VALIGN="top"> March </TD> <TD ALIGN="right" VALIGN="top"> 150,000 </TD> <TD ALIGN="center" VALIGN="top"> N </TD> <TD ALIGN="left" VALIGN="top"> Starting to recover </TD> </TR> <TR> <TD ALIGN="left" VALIGN="top"> April </TD> <TD ALIGN="right" VALIGN="top"> 1,000,000 </TD> <TD ALIGN="center" VALIGN="top"> </TD> <TD ALIGN="left" VALIGN="top"> We're back in the clover! </TD> </TR> </TABLE>